All of you undergraduates out there are probably enjoying your winter break. Not to alarm you, but it's probably time to start thinking about your summer! Don't have any plans yet? Well, consider signing up for the Research Training Program (RTP) at the National Museum of Natural History.
In short, the RTP is a 10 week internship program at the Smithsonian, where you partner with an established curator on a research project. As part of this, you get a stipend, free housing, small travel allowance, and a behind-the-scenes summer in one of the nation's coolest museums.
I had the opportunity to participate back in 2000 - and it was a fantastic summer! The skills I learned there were easily transferred into my subsequent research (and D.C. is a great city to get to know!). Heck, you might even end up working there permanently if you're lucky, as happened to Gene Hunt. He was a member of the RTP class of 1995, and is now curator of ostracods! So, apply if you're eligible - you won't regret it!
Tuesday, December 30, 2008
Nuts and Bolts of Edited Volumes
What fantastic timing! Dave Hone has just posted his perspectives on "How to edit a volume of papers." The post provides a behind-the-scenes look at the editorial process, from someone who has just finished up a major project (Flugsaurier: Pterosaur Papers in Honour of Peter Wellnhofer -- a must-have for anyone with pterosaur or general archosaur inclinations). Go check it out!
Saturday, December 27, 2008
Nuts and Bolts of Peer Review II
In the previous posting, I talked about the lead-up to the peer review process. Here, I'll discuss what I look for when I'm reviewing a paper.
The Text
This is the part of the review that usually takes the most time. I read through the entire paper from start to finish, usually in about two sittings. I find that if I try to plow through the whole thing at once, I'll get a little lazy towards the end (especially if it's a really long paper). As I read, I look carefully at every aspect of the text. Is each section logically and carefully written? Are all of the necessary references cited? Could the authors cite a few more papers? Are any portions of the paper redundant or superfluous? Is more detail needed in some sections?
In the introduction, I look to make sure that the authors really introduce their topic. I want to see a good case made for the necessity of the research, with a clear summary of previous work. It doesn't look good if the authors ignore previous publications on the topic--it gives the perception that they didn't do the sufficient background research or that they're downplaying others' contributions and overplaying their own.
In the methods section, I want to see a full explanation of what the authors did. If there's a novel method, it sure as heck had better be written up in detail. In cases of well-established methods, it's usually ok to just refer to a previous paper.
In the results section, I read through and make sure that the results make sense, and that the various graphs and tables match up with the data. For that matter, are there graphs and tables? If there's a description of specimens, I want to see good, clear text that fully describes the specimens under investigation. Figures, photos, and diagrams are important in this regard. Also, it's great to see lots and lots of measurements. If a structure is "relatively large," how large is it, and in relation to what?
The discussion and conclusions are usually where I pay very close attention. This is the "meat" of the paper, and the part that will often have the most impact on future researchers. Do the interpretations flow from the results? Are there alternative interpretations? Do the authors lay out any further questions that arise from the data? How do the interpretations of this paper fit into the broader literature? Once again, I want to see why this paper is important (without overselling the research). Many times, the discussion and conclusions "make or break" the paper for me as a reviewer.
Illustrations
Do the illustrations show what the authors want them to show? Are there enough illustrations? Too many? Is color necessary or helpful? When I'm reviewing illustrations, I try to look at the problem from two different angles. As a paleontologist, I will probably rely on the figures as a reference in the future. So, I want to make sure that the figures are as useful as possible! For photographs, is the resolution appropriate? Is there a scale bar? Are contrast and lighting such that the relevant features are clearly visible? Are the views of the specimens sufficient, or are there other views that might be useful additions to the paper?
The second angle is more of an aesthetic one, although this frequently ties into the previous angle. Are the figures attractive? Is there too much white space, or not enough between panels of a multi-part figure? For graphs, are the symbols legible? If color is used in a chart, is the color necessary or could it be turned into a grayscale without loss of information or clarity (this could save a lot of money for the authors and/or the publisher, because color pages ain't cheap!)? If color is used, are red and green featured in a way that will make life difficult for the color-impaired (there are quite a few of color-blind folks out there)?
Size also matters. Is the full-page illustration suggested by the author really necessary, or could it be a single column figure without loss of information? Is that single-column figure just too small to show this critical feature?
Finally, I'll read the caption with the figure. Does the caption make sense? Is everything labeled correctly?
By and large, paleontologists do a good job with figures. We're usually pretty visual folks, and there are some great graphical eyes out there. So, this is often one of the "fun" parts of the review.
Don't Forget the Basics
There are always some basic tasks that I try to undertake in reviews.
If there is a phylogenetic analysis, I'll run the dataset myself and see if I can duplicate the author's (authors') results. Sometimes an old version of the tree will accidentally "piggyback" into the final version of the manuscript or figures, and it's important to be able to catch this. I'll also "spot check" any matrices to make sure that things are coded correctly (within reason, of course).
For statistics, I want to make sure that A) the methods are appropriate to the question; B) the assumptions of the statistical methods are met; and C) the discussion of the results logically follows from the results themselves. As an author, I try (sometimes less successfully than more successfully) to follow these three criteria when designing and writing up my research.
Finally, I'll check the reference list against the text citations. It's amazing how frequently citations slip between the cracks (even in this age of Zotero and Endnote), even in my own writing. This is always the last thing I do with a paper before writing up my review--I read through the manuscript from start to finish, and mark each citation in the bibliography. If anything's missing (or extra), this is noted for the authors. Missing or extra citations are never a big deal in terms of manuscript acceptibility, but catching them is important for ensuring the overall quality of presentation.
The Final Write-Up
The last step for a reviewer is to write up the review in an intelligible manner, both for the editors and the authors. Of course, they'll all be getting the marked-up copy of the manuscript. But, I also think it's important to have a more narrative summary of the review. This is usually a page or so in length, and I'll cover a handful of topics.
First, I'll write a little summary paragraph--stating authors, title, and the main point of the article. I'll try to summarize my opinion on the clarity of the writing and figures, as well as the general quality of the science and novelty of the research. I also like to provide a brief statement on the probably interested audience for the paper--specialists on a particular taxon, workers in a particular subfield, a general audience, etc. Finally, I provide my opinion on the overall publishability of the paper--major or minor revision, or (very, very rarely) unacceptable in current format. These are just opinions, of course--the editors always have the final say.
Next, there's a section on "general comments." If the authors did something really great, I'll put that here. It's depressing to get a review back where the reviewers don't acknowledge the good points of the paper, and as an author I've always appreciated advice on what I'm doing well. The most important information, though, is the broad comments on the paper. Is the overall analysis well-conceived? Etc.
Finally, I write up a section of "specific comments." These are organized by page, paragraph, line number, and address individual sections of the text. Is there a misprint here? Should they have cited someone else there? Is this or that sentence not completely clear?
Anonymity or No?
In many scientific fields and for some journals, anonymity of reviewers is a given. Ostensibly, this is to protect the reviewers from potential future retribution as well as to ensure that previous personality clashes between the reviewers and the authors don't lead the authors to unreasonably reject comments. Some journals, however, allow one to "sign" a review. When given this option, I'll take it. For one, I try to avoid writing anything that I wouldn't be willing to say to the authors in person (although perhaps exceptional circumstances might someday lead me to reconsider). This doesn't mean I won't dispute crummy research--just that I won't hide behind anonymity in order to pursue a personal agenda. Secondly, I think it's useful to the authors to be able to contact the reviewers if there are any specific questions. This doesn't happen often, but I have occasionally had to pursue this route as an author myself. Finally, paleo is a small field, and how easy is it to remain truly anonymous? There might only be three experts on taxon X, and two of them are authors on the paper. It doesn't take a tenured professor to figure out who at least one of the anonymous reviewers might be (especially when the anonymous reviewer recommends the citation of 12 different papers, all by the same author).
So, that's how I usually go about reviewing papers. Everyone has a slightly different method and emphasis, but this seems to work for me. Any thoughts? Comments? For you authors, what is most useful for you when you receive reviews?
In the final post of this series, responding to reviews. . .
Tuesday, December 23, 2008
Nuts and Bolts of Peer Review
Peer review is one of the important cornerstones of academic paleontology--this process attempts to ensure that manuscripts considered for publication contain good science from start to finish. It certainly ain't perfect, but until someone proposes a practical, consistently-applicable alternative, peer review (when properly implemented) is a pretty effective "gatekeeper" of the literature.
Of course, peer review relies on us--the scientists. If you're at all interested in academic paleontology, you have been, are, or will be involved in this process at some level. Personally, I've been very fortunate to take part in peer review at both the "giving" and "receiving" end. In this series of posts, I'll talk about my approach to reviewing manuscripts (which I've now done for a number of journals and other publishers) and receiving reviews of my own papers. The intent is not to say that my philosophies are perfect (or that I follow them perfectly myself)--they'll certainly change as I gain experience as a researcher and a reviewer. Instead, the purpose is to provide some insight into the process for those who are relatively new to the field.
Why Participate in Peer Review?
From a pragmatic perspective, you have to play the game if you want to get into the literature (in most cases). From a scientific perspective, peer review ostensibly separates the wheat from the chaff (or at least lets the chaff blow over to another journal). Like it or not, peer review is something every scientist has to face.
Personally, I have found the process to be quite rewarding. As an author, the feedback I receive from reviews is invaluable--and no matter how much it hurts sometimes, the reviewers are usually right. They catch my awkward sentences, inappropriate analogies, and convoluted analyses. Sometimes they'll even suggest new angles that greatly increase the scientific value of the paper. Often, it involves more work--but my papers are always better for it. Sure, it's never fun to have mistakes pointed out, but I'd much rather this happen at the manuscript stage than in a public rebuttal on the pages of a journal or blog.
As a reviewer, I just have fun with it! First, I won't deny that it's a bit of an ego boost to be asked to review a paper. Beyond this, it's very gratifying to be able to use some of my (obscure) research skills to contribute to the scientific process. Science involves community--and peer review is an important civic duty. Also, it's kinda fun to learn about the latest breaking research months before it appears officially in print.
Why Me (or Her, or Him) as a Reviewer?
Journals usually find their reviewers through two sources--from the authors or from an informal "reviewer pool." As an author, you always have the option to suggest a list of potential reviewers (whether in the cover letter or in a specific part of the online submission form). This also means you can suggest the exclusion of reviewers. If you think that Professor X will give an unfair review no matter how good your paper is, it's perfectly within your rights to request he or she be excluded as a reviewer (and there's no need to say why). But, recognize that it's also perfectly within the journal's rights to ignore your suggestion. However, my general sense is that journal editors will try to respect authors' wishes whenever possible. So, this is probably the most control you (as an author) have over the process (aside from writing good quality papers). It goes without saying that one shouldn't abuse this privilege--don't try and pack the review panel with "easy" reviewers (good editors will see right through this), or exclude someone just because you think they might be "tough." An editor once told me that authors don't realize that the referees suggested by the authors are often the toughest critics of manuscripts!
The second source of reviewers for journals is from a "reviewer pool"--the informal list of experts whom editors think would know something about the manuscript in question. The easiest way to get into this pool is to publish your own quality work. Once you're known as an expert in hadrosaur hindlimb biomechanics, the odds are pretty good that you'll get papers to review on hadrosaurs, hindlimbs, biomechanics, or any combination of the three.
Edited volumes present a special case. Typically, the editor(s) for such a volume will draw from the contributing authors as reviewers for each others' papers. If you're the sort of person who likes reviewing papers (or whom the editors learn does a good job at reviewing), this can be a lot of fun, and/or a lot of work.
What Happens
The first step in the process, for a reviewer, is an email from the journal editor. Often, this comes as a form letter with the paper title, list of authors, and perhaps the abstract. The reviewer is given a choice--will you accept the responsibility of reviewing, or decline?
A reviewer may choose to decline for one of several reasons. Perhaps he or she doesn't have time at the moment to review the manuscript properly. Perhaps the manuscript is so completely out of the expertise of the reviewer that it's not worth the effort. Or, maybe the requested reviewer had a non-negligible role in the research, and it thus wouldn't be appropriate to review the manuscript.
If the reviewer has seen the manuscript before, this requires some care. Perhaps it was as a reviewer for another journal from which the paper was rejected. Perhaps the reviewer looked over the paper for the authors before they submitted the final version. Either way, it's usually a good idea to let the editors know. These aren't deal-breakers (manuscripts can change substantially between drafts, after all), but editors usually appreciate knowing this sort of information.
Accepting the invitation to review a paper is a grave responsibility, with lots of unwritten obligations. As a reviewer, you promise to provide a fair, thorough, and timely report on the manuscript. The Golden Rule applies here--would I, as an author, want to receive a sloppy evaluation delivered a year after initial submission, in which the referee clearly hadn't bothered to read the paper? Hopefully the answer is obvious.
Coming soon. . .reviewing text, figures, analyses, and much more!
Monday, December 15, 2008
Dinosaurs Making a Difference in Madagascar
At this time of year, many people think about giving to those in need. Now, there are a lot of good charities out there doing good work - but this year, I'd like to suggest one with a special connection to paleontology.
The Ankizy Fund (it's pronounced ann-KEE-zee) was founded by Dr. Dave Krause from the Department of Anatomical Sciences at Stony Brook University. Many of the readers of this blog know of the fantastic discoveries that Dave and his colleagues have made in the late Cretaceous Maevarano Formation of Madagascar - the buck-toothed Masiakasaurus, the pug-nosed, plant-eating crocodile Simosuchus, the bird-dinosaur link Rahonavis, the spectacularly preserved specimens of Majungasaurus, and many others. Few, however, are aware of the stark poverty that surrounds the rich exposures of Cretaceous rock. Literacy rates are near zero in many rural areas of Madagascar. Over 11,000 children die annually from malaria. Nationally, there are only 24 doctors and 2 dentists for every 100,000 people. The distended bellies you commonly see in children are not signs of overeating, but rather malnutrition and heavy parasite loads.
Faced with all of this in the midst of their field area, Krause and his colleagues knew they had to do something. So, the Ankizy Fund sprang into existence. "Ankizy" is the Malagasy word for "children" - those whom the efforts are focused on. Through dental clinics, basic care and instruction in oral hygiene are provided. Simply pulling an infected tooth can save a kid's life. Health clinics offer immunizations and basic check-ups. Wells offer a chance at clean water. And, schools provide the gift of education. Although the Ankizy Fund cannot solve all of the problems in Madagascar (and there are many), it has made a good start at several locations throughout the country.
I have had the good fortune to work in northwestern Madagascar on several expeditions, as well as the opportunity to see the fruits of the Ankizy Fund in action. It's a rare combination of paleontology and humanitarianism. . .and a truly wonderful one at that. Please, consider donating today. Any amount helps!
 And now back to our regularly scheduled blogging. . .
Saturday, December 13, 2008
3D Slicer: The Tutorial Part IV
Wow, there sure are a lot of steps to make a three-dimensional model from CT scan data. So far, we've loaded data, looked at the data, and segmented the skull in preparation for making a model. Now, we're really and truly ready to make the model.
New Beginnings
Just as you did at the beginning of this tutorial, start Slicer. Now, instead of doing everything from Square 1, we'll just reload the previously saved data files. Under the "File" menu, select "Load Scene." A dialog box should come up. Navigate to the directory where you saved your scene file ("ankylosaur," right?), and click on it. At right, you'll see a file called "anky.mrml." This is your scene!
Select this file, and then hit the "Open" button at the bottom of the dialog box. You'll see a little message that indicates the old scene is being loaded.
After a few seconds, you'll notice that everything is right back where you left it! Labels, DICOMs, all of those are loaded.
Seeing in 3D
You're probably wondering when and if you'll ever get to make a 3D model. So, let's get down to it!
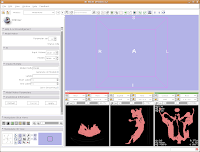
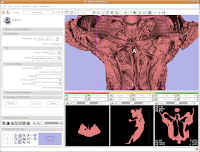
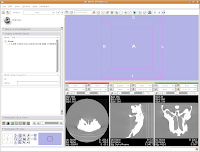
We're now going to create a 3D surface model of the segmented data. In order to see what we're doing, let's first change the views from the single slice to one that will allow us to see the 3D image we're creating. Go up to the toolbar, and find the layout button (it should say "Choose among layouts for the 3D and Slice viewers" when you mouse over it). Click on it to bring up the menu of possible views, and click on "Convential layout." The lavender-colored area is where the completed 3D model will eventually reside.
 Click on the "Modules:" button on the toolbar, and go down until you find "Model Generation." Another little submenu comes up, and click on "Model Maker." Now, the left-most side of the Slicer screen will change to show the "Model Maker" parameters. We'll want to change a few of these in order to get going.
First, you see a little option called "Parameter set". Click on the up or down arrows next to this, until you find "Model Maker1".
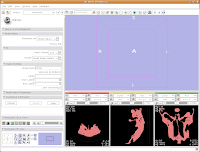
Below this you see options for "Input Volume" and "Models." Click and hold on the "Input Volume" option, and select "skull." This is the label map we created earlier. Next, click and hold on the selector next to "Models," and select "Create New Model Hierarchy."
Finally, you'll see a little area where you can type in "Labels." As you may remember, our label color for the skull was "5" (vessels). If you forgot this, you can just slide your mouse over the segmented images in the lower right part of your screen. As you slide over the red areas, you'll see a little indicator in each CT slice viewer that says, "Lb: 5.0". Slide off of the red areas, and the indicator goes to "Lb: 0.0". "5" is the color of your segmented bone, and "0" is the unsegmented, black areas. So, in the "Labels" area at left, type "5".
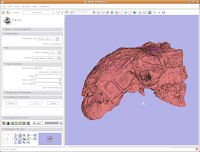
Now for the moment of truth. . .hit "Apply," and sit back and relax while your model is created! Things will go gray at the left of your screen while the model is computed, and at the bottom of the screen a little progress indicator gives helpful information.
After about 20-30 seconds (or more, depending on the speed of your computer), a model will appear in the 3D viewer. All of your hard work has paid off!
 Looking at the model
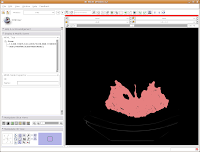
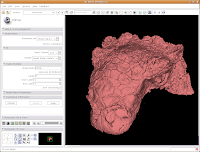
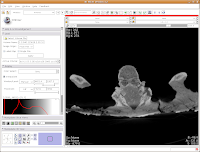
Most likely, you can't see the entire model right now. So, change the view (under the layout options button) to the 3D only layout. Just like in the slice views, you can zoom in and out, and even rotate the image.
To zoom, hold down the right mouse button and drag up and down on the screen. Or, spin the middle mouse wheel. To pan the image, hold down the middle mouse button drag around the screen. To rotate the image, hold down the left mouse button and drag. You're getting a privileged look at a rare dinosaur specimen!
Changing views
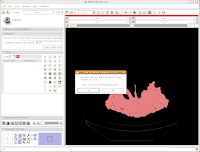
Of course, now you've got a red ankylosaur skull on a lavender background, with pink lines going through the middle of everything. Fortunately, Slicer is remarkably customizable.
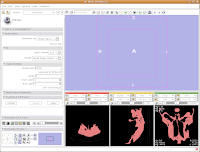
In the lower left part of the screen, you'll see a set of buttons under the title of "Manipulate 3D View." To change the background color, find the button that pops up a context menu of "Toggle visibility of elements in the 3D view". It looks like a little eye. Click and hold, and select "Black background." You should see the background of the 3D view change to - you guessed it - black. To get rid of the pink box and axis labels, go back to the same button, and deselect the options for "3D cube" and "3D axis labels."
 Now, let's make our ankylosaur skull a more "natural" color. Under the "Modules:" drop-down toolbar at the top, select "Models". The bar at left will change, and you'll see a whole new set of options.

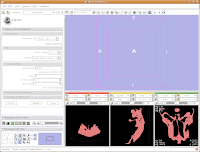
Click on "Load" to contract this set of options, and click on the "Hierarchy & Display" bar to expand this area.

Under the "Model Hierarchy" area, click on "Model." This is the model of the skull that we just created. Now, we can change some colors. Because the options go for quite a ways, you may have to use the scroll bar to go down a little. Click on "Set Color..." (either the red colored box or the text next to it).
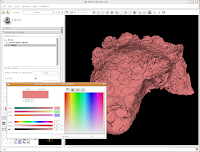 This brings up a whole new dialog box, with a world of colors! On the area at right, you can drag around to find a new color. Alternatively, if the choices overwhelm you, there is another way. You'll notice a few tabs above the color palatte. Click on the one that brings up the "Basic Colors" option. A much more limited set of options now appears.
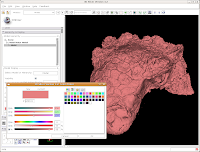
In the interest of making it look like an unfossilized skull, select the white at the end of the fourth row. Then, hit "OK."
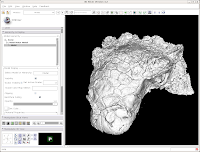
You've now got a sparkling-white Ankylosaurus skull! You can rotate, zoom, and inspect morphology to your heart's content.
Finishing Up
For the end of this tutorial, let's save our work to date. Under "File," select "Save." Everything should be the same as before, except there's a new entry for the skull model.
Check to ensure that it's being saved in the ankylosaur directory (it should be, if all went well), and hit "Save." You're all done! The model is now saved in VTK format, and can be reloaded later.
That's all for this phase. You've loaded data, segmented it, created a model, and saved your work. In January, I'll begin the next phase of the tutorial - talking about how to segment out specific structures (e.g., the endocranial cavity), make measurements, and the like. For now, enjoy your newfound skills!
New Beginnings
Just as you did at the beginning of this tutorial, start Slicer. Now, instead of doing everything from Square 1, we'll just reload the previously saved data files. Under the "File" menu, select "Load Scene." A dialog box should come up. Navigate to the directory where you saved your scene file ("ankylosaur," right?), and click on it. At right, you'll see a file called "anky.mrml." This is your scene!

Select this file, and then hit the "Open" button at the bottom of the dialog box. You'll see a little message that indicates the old scene is being loaded.

After a few seconds, you'll notice that everything is right back where you left it! Labels, DICOMs, all of those are loaded.

Seeing in 3D
You're probably wondering when and if you'll ever get to make a 3D model. So, let's get down to it!
We're now going to create a 3D surface model of the segmented data. In order to see what we're doing, let's first change the views from the single slice to one that will allow us to see the 3D image we're creating. Go up to the toolbar, and find the layout button (it should say "Choose among layouts for the 3D and Slice viewers" when you mouse over it). Click on it to bring up the menu of possible views, and click on "Convential layout." The lavender-colored area is where the completed 3D model will eventually reside.
 Click on the "Modules:" button on the toolbar, and go down until you find "Model Generation." Another little submenu comes up, and click on "Model Maker." Now, the left-most side of the Slicer screen will change to show the "Model Maker" parameters. We'll want to change a few of these in order to get going.
First, you see a little option called "Parameter set". Click on the up or down arrows next to this, until you find "Model Maker1".

Below this you see options for "Input Volume" and "Models." Click and hold on the "Input Volume" option, and select "skull." This is the label map we created earlier. Next, click and hold on the selector next to "Models," and select "Create New Model Hierarchy."
Finally, you'll see a little area where you can type in "Labels." As you may remember, our label color for the skull was "5" (vessels). If you forgot this, you can just slide your mouse over the segmented images in the lower right part of your screen. As you slide over the red areas, you'll see a little indicator in each CT slice viewer that says, "Lb: 5.0". Slide off of the red areas, and the indicator goes to "Lb: 0.0". "5" is the color of your segmented bone, and "0" is the unsegmented, black areas. So, in the "Labels" area at left, type "5".

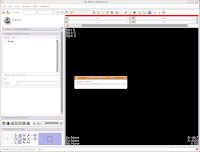
Now for the moment of truth. . .hit "Apply," and sit back and relax while your model is created! Things will go gray at the left of your screen while the model is computed, and at the bottom of the screen a little progress indicator gives helpful information.

After about 20-30 seconds (or more, depending on the speed of your computer), a model will appear in the 3D viewer. All of your hard work has paid off!
 Looking at the model
Most likely, you can't see the entire model right now. So, change the view (under the layout options button) to the 3D only layout. Just like in the slice views, you can zoom in and out, and even rotate the image.

To zoom, hold down the right mouse button and drag up and down on the screen. Or, spin the middle mouse wheel. To pan the image, hold down the middle mouse button drag around the screen. To rotate the image, hold down the left mouse button and drag. You're getting a privileged look at a rare dinosaur specimen!
Changing views
Of course, now you've got a red ankylosaur skull on a lavender background, with pink lines going through the middle of everything. Fortunately, Slicer is remarkably customizable.
In the lower left part of the screen, you'll see a set of buttons under the title of "Manipulate 3D View." To change the background color, find the button that pops up a context menu of "Toggle visibility of elements in the 3D view". It looks like a little eye. Click and hold, and select "Black background." You should see the background of the 3D view change to - you guessed it - black. To get rid of the pink box and axis labels, go back to the same button, and deselect the options for "3D cube" and "3D axis labels."
 Now, let's make our ankylosaur skull a more "natural" color. Under the "Modules:" drop-down toolbar at the top, select "Models". The bar at left will change, and you'll see a whole new set of options.
Click on "Load" to contract this set of options, and click on the "Hierarchy & Display" bar to expand this area.

Under the "Model Hierarchy" area, click on "Model." This is the model of the skull that we just created. Now, we can change some colors. Because the options go for quite a ways, you may have to use the scroll bar to go down a little. Click on "Set Color..." (either the red colored box or the text next to it).
 This brings up a whole new dialog box, with a world of colors! On the area at right, you can drag around to find a new color. Alternatively, if the choices overwhelm you, there is another way. You'll notice a few tabs above the color palatte. Click on the one that brings up the "Basic Colors" option. A much more limited set of options now appears.
In the interest of making it look like an unfossilized skull, select the white at the end of the fourth row. Then, hit "OK."

You've now got a sparkling-white Ankylosaurus skull! You can rotate, zoom, and inspect morphology to your heart's content.
Finishing Up
For the end of this tutorial, let's save our work to date. Under "File," select "Save." Everything should be the same as before, except there's a new entry for the skull model.

Check to ensure that it's being saved in the ankylosaur directory (it should be, if all went well), and hit "Save." You're all done! The model is now saved in VTK format, and can be reloaded later.
That's all for this phase. You've loaded data, segmented it, created a model, and saved your work. In January, I'll begin the next phase of the tutorial - talking about how to segment out specific structures (e.g., the endocranial cavity), make measurements, and the like. For now, enjoy your newfound skills!
Friday, December 5, 2008
3D Slicer: The Tutorial Part III
Alrighty, now we're really going to get something done with Slicer. So far in this tutorial series, we've learned how to start the program and load data, as well as how to take a look at these data in various views. In this part of the tutorial, we'll segment the data. To get started, you'll want to have completed all of the steps in the last two posts. Go back to the "Red Slice only layout," and fit it to the window.
Thresholding
Looking at the CT data is fun, but we all know this isn't the only reason for using CT scans. Let's make a three dimensional rendering of the data!
The process of selecting the "useful" parts of a CT image for further analysis (whether creating a 3D model, volume measurements, or whatever) is called segmentation. In Slicer, you don't change the actual slices, but create a "label" that is overlain on top of the image. The label is color coded to indicate what you're trying to segment - for instance, you might have all of the bone in blue and the endocranial cavity in red.
Slicer accomplishes all of its segmentation in the "Editor." To get there, go up to the top toolbar, and click on the drop-down menu next to "Modules:", and then select "Editor." The screen will change at the left, and you should see a whole new set of gizmos to work with.
First things first, though. We'll want to name our label map. The default is "Working," but let's make it something more intuitive - so, type in "skull" as the label map name, and then hit the "Create Label Map" button immediately below the dialog box.

Things should chug along for a moment, and then you'll see the screen jump back to the default "middle" slice of the CT stack. This is ok - as you learned already, it's easy to navigate!
The first important thing to note is that at the left of your screen, under tools, you'll see a little blue box next to a box with "Label 1". This indicates the color of the label map that you're creating. If you want a different color, you can hit the up or down arrows, or click on the colored box to bring up all of the available colors. Try the latter approach.
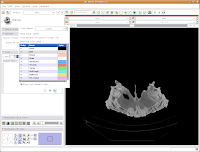
Then click on "Vessels," to change everything to a nice red. You'll notice all of the colors have funky, non-paleontological names. This is because the Slicer software was originally developed for biomedical applications, particularly brain imaging.

Now, we're ready to segment! There are all sorts of different ways to segment. . .you can outline each individual element on each individual slice (tedious after the first 20 or 30 slices!), use a "fill" tool to fill certain areas, or just a plain-old threshold. For starters, we'll use a threshold, because it's quick, easy, and useful.
You'll note a whole series of buttons on the left column of the Slicer program window. As you mouse over them, little labels will pop up to guide you. Find the one with a white-to-black gradient on it; it should say "Treshold" as your pointer passes over it. Click on it. Now, things start to look crazy!
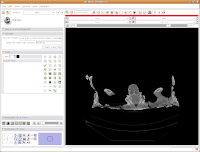
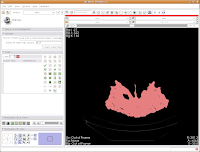
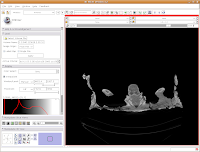
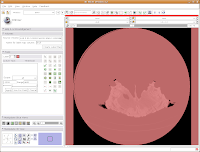 You'll see a pulsating red overlay on the CT scan image at right. . .everything that is in red will be segmented if you hit the "apply" button. But, you'll notice that lots of unnecessary junk is highlighted. To get rid of this, you use the slider bars at the left side of the screen. Just like with the windows and level dialog, you can also type in numbers. Slide the bar around until only the skull is highlighted, but not the CT gantry at the bottom of the image, or the air, or anything else. If found good results around a minimum of 560.51 and a maximum of 4691. While you play with this, you can slide back and forth through the stack, to see how the threshold works for the entire skull. You may have to adjust to find something that works throughout.
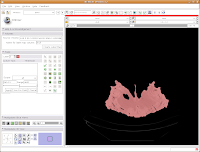
Now, hit the "Apply" button. Things chug along for a moment or two, and then it's all done! The threshold dialog will disappear, and your image is now thresholded.
So, the whole image is now segmented. To prove this, you can slide back and forth through the stack of images, and you'll notice that the skull is colored in red throughout. But remember--unless you hit "Apply," your hard work for thresholding won't be remembered by the program.
Saving Face
You (and your computer) have been working pretty hard so far. Before we go any further, let's save your efforts. It's a good idea to save frequently, to protect yourself against data loss.
There are two important things you'll want to save so far. . .your label map (the information on how you segmented the skull) and the "Scene" file. The scene file contains information on all of the files you loaded so far - it makes it easy to quickly reload everything without having to load the CT data and label files individually. This doesn't sound like much at this stage, but it can get quite complicated when you have multiple volumes or label maps involved!
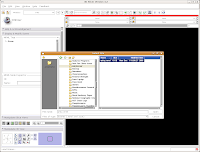
The latest versions of Slicer make it pretty easy to save your work. Under the menu at the very top, go to "File" and then click on "Save." The resulting dialog box has two main portions: Save Scene and Save Data.
First, let's choose a name for our Scene File. Click on the little folder next to Scene File. A new dialog box comes up, and you can choose where to save the file. You may wish to create a new folder on your Desktop called "ankylosaur" to contain these files. I did this, by clicking the "create folder" button near the top of the dialog.
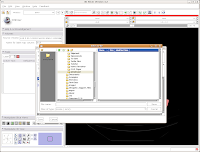
Then, I named my scene file "anky" (by typing this in the "File name:" box, and hit the "Save" button.

The scene dialog box disappears, and we're back to the previous "save data" dialog.
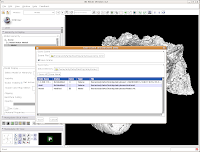
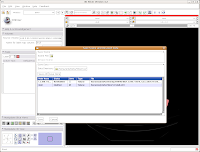
Under "Save Data", you'll see two listings, identified under "Node Name". One begins "1.2.840.113...", and this is the original DICOM file we loaded. Because it wasn't ever changed, there is no reason to save this. Below that, you'll see "skull." This is our label map, and we want to save it. Slicer's default is to place it in the Slicer program directory. But, we don't want to do this. Instead, click on the area next to "Data Directory." This brings up a new menu.
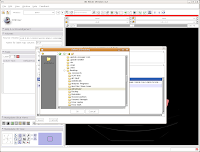
Navigate to the "ankylosaur" folder that you created previously, and select it. Hit "OK." Now, you'll see that the label map will be saved to this directory.
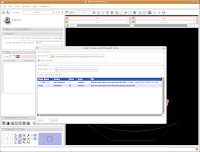
We're finally ready to save the files - so, hit the "Save" button at the bottom of the dialog box. Your computer will chug along for a few seconds, and then it's finished. The dialog box will disappear, and everything should be saved (assuming you followed the directions successfully).
Let's quit Slicer, and go enjoy a bit of your day away from the computer. Under the File menu, select Exit. The program will ask if you really want to leave (I know, you were just starting to have some fun!), and hit "Yes."
Here ends Part III of the tutorial. . .in the next post, we'll actually make a digital model of the skull!
Thresholding
Looking at the CT data is fun, but we all know this isn't the only reason for using CT scans. Let's make a three dimensional rendering of the data!
The process of selecting the "useful" parts of a CT image for further analysis (whether creating a 3D model, volume measurements, or whatever) is called segmentation. In Slicer, you don't change the actual slices, but create a "label" that is overlain on top of the image. The label is color coded to indicate what you're trying to segment - for instance, you might have all of the bone in blue and the endocranial cavity in red.
Slicer accomplishes all of its segmentation in the "Editor." To get there, go up to the top toolbar, and click on the drop-down menu next to "Modules:", and then select "Editor." The screen will change at the left, and you should see a whole new set of gizmos to work with.

First things first, though. We'll want to name our label map. The default is "Working," but let's make it something more intuitive - so, type in "skull" as the label map name, and then hit the "Create Label Map" button immediately below the dialog box.

Things should chug along for a moment, and then you'll see the screen jump back to the default "middle" slice of the CT stack. This is ok - as you learned already, it's easy to navigate!

The first important thing to note is that at the left of your screen, under tools, you'll see a little blue box next to a box with "Label 1". This indicates the color of the label map that you're creating. If you want a different color, you can hit the up or down arrows, or click on the colored box to bring up all of the available colors. Try the latter approach.

Then click on "Vessels," to change everything to a nice red. You'll notice all of the colors have funky, non-paleontological names. This is because the Slicer software was originally developed for biomedical applications, particularly brain imaging.

Now, we're ready to segment! There are all sorts of different ways to segment. . .you can outline each individual element on each individual slice (tedious after the first 20 or 30 slices!), use a "fill" tool to fill certain areas, or just a plain-old threshold. For starters, we'll use a threshold, because it's quick, easy, and useful.
You'll note a whole series of buttons on the left column of the Slicer program window. As you mouse over them, little labels will pop up to guide you. Find the one with a white-to-black gradient on it; it should say "Treshold" as your pointer passes over it. Click on it. Now, things start to look crazy!
 You'll see a pulsating red overlay on the CT scan image at right. . .everything that is in red will be segmented if you hit the "apply" button. But, you'll notice that lots of unnecessary junk is highlighted. To get rid of this, you use the slider bars at the left side of the screen. Just like with the windows and level dialog, you can also type in numbers. Slide the bar around until only the skull is highlighted, but not the CT gantry at the bottom of the image, or the air, or anything else. If found good results around a minimum of 560.51 and a maximum of 4691. While you play with this, you can slide back and forth through the stack, to see how the threshold works for the entire skull. You may have to adjust to find something that works throughout.
Now, hit the "Apply" button. Things chug along for a moment or two, and then it's all done! The threshold dialog will disappear, and your image is now thresholded.

So, the whole image is now segmented. To prove this, you can slide back and forth through the stack of images, and you'll notice that the skull is colored in red throughout. But remember--unless you hit "Apply," your hard work for thresholding won't be remembered by the program.
Saving Face
You (and your computer) have been working pretty hard so far. Before we go any further, let's save your efforts. It's a good idea to save frequently, to protect yourself against data loss.
There are two important things you'll want to save so far. . .your label map (the information on how you segmented the skull) and the "Scene" file. The scene file contains information on all of the files you loaded so far - it makes it easy to quickly reload everything without having to load the CT data and label files individually. This doesn't sound like much at this stage, but it can get quite complicated when you have multiple volumes or label maps involved!
The latest versions of Slicer make it pretty easy to save your work. Under the menu at the very top, go to "File" and then click on "Save." The resulting dialog box has two main portions: Save Scene and Save Data.

First, let's choose a name for our Scene File. Click on the little folder next to Scene File. A new dialog box comes up, and you can choose where to save the file. You may wish to create a new folder on your Desktop called "ankylosaur" to contain these files. I did this, by clicking the "create folder" button near the top of the dialog.

Then, I named my scene file "anky" (by typing this in the "File name:" box, and hit the "Save" button.

The scene dialog box disappears, and we're back to the previous "save data" dialog.
Under "Save Data", you'll see two listings, identified under "Node Name". One begins "1.2.840.113...", and this is the original DICOM file we loaded. Because it wasn't ever changed, there is no reason to save this. Below that, you'll see "skull." This is our label map, and we want to save it. Slicer's default is to place it in the Slicer program directory. But, we don't want to do this. Instead, click on the area next to "Data Directory." This brings up a new menu.

Navigate to the "ankylosaur" folder that you created previously, and select it. Hit "OK." Now, you'll see that the label map will be saved to this directory.

We're finally ready to save the files - so, hit the "Save" button at the bottom of the dialog box. Your computer will chug along for a few seconds, and then it's finished. The dialog box will disappear, and everything should be saved (assuming you followed the directions successfully).
Let's quit Slicer, and go enjoy a bit of your day away from the computer. Under the File menu, select Exit. The program will ask if you really want to leave (I know, you were just starting to have some fun!), and hit "Yes."

Here ends Part III of the tutorial. . .in the next post, we'll actually make a digital model of the skull!
Tuesday, December 2, 2008
MapWindow GIS
Randy Irmis just passed on what looks like a very useful, feature-rich, open source GIS application - MapWindow GIS. Because the center of the application is an ActiveX control, this program will be most at home on Windows. I haven't yet had a chance to try it out yet, but would love to hear from anyone who has!
3D Slicer: The Tutorial Part II
In the previous post in this series, we got started with using Slicer. So far, we've opened up a stack of DICOMs, and are ready to get to work. In this post, we'll learn how to take a look at the slices.
Looking at the Data
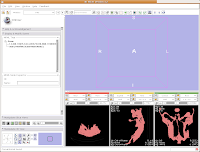
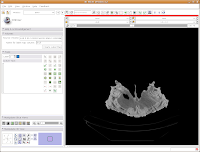
One of the really nice things about Slicer is that it automatically shows the image with three orthoganal slices. These should appear in three little windows in the lower right of your Slicer screen.
You'll notice that the images are a little small, and that they look a little washed out. Never fear, there are ways to fix this! Let's take care of them one at a time.
In order to resize the images, mouse across the toolbar at the top of the screen, until you see the button that pops up with a menu that says "Choose among layouts for the 3D and slice viewers." It looks like a little mini version of the Slicer screen. Click on it, and select "Four-up layout". This shrinks the lavender winder (the 3D window that will eventually display your model) and makes the CT slices bigger.
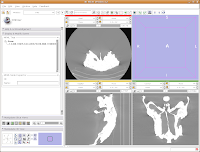
Next, go to the same menu and select "Red slice only layout." Now, the view in the red slice should fill the whole screen. Get the idea? We'll leave it in the current view for now.

Next, let's take care of the washed-out look of the CT slice. This is a problem fixed by adjusting the windows and levels. Essentially, this is a fancy CT imaging trick akin to adjusting brightness and contrast of a picture in Photoshop (or GIMP). To play with this, go to the toolbar at the top again, and find the drop-down menu net to "Modules:". Under this menu, click on "Volumes." A new interface pops up on the left side of the screen, and we can get down to business.
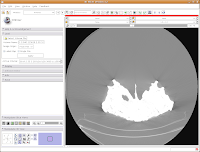
The important part of this multi-layered interface is labeled "Display." So, click on this. If you have to, scroll down so that the whole "Display" module is in view.
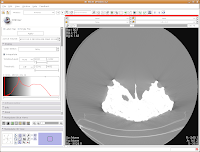
Now, you'll see a little slider beneath the row that says, "Window/Level". Click and drag with your mouse on this slider to start changing the windows and levels. As you do so, you should note the CT slice at left changing. If you click on one of the window/level handles, you can drag it around to the left or right (on either slider). If you click on the space between the two sliders and drag, you'll move both sliders together. If you don't feel like all this stupid GUI stuff, you can just type values in the boxes above the sliders. In the end, I liked what I saw at 4451.4,1507.5. The shades of black were distinctive on my monitor, and I saw nice contrast between the fossil bone and matrix.
Let's play with the data! To move back and forth through the stack of images, move the slider above the CT image. You'll see the visible images change forward and backward through the skull. Pretty cool, huh? The number at right tells you how many millimeters you are through the image, from the midpoint of the stack. Notice that as you move the slider, the numbers move by increments of 1.25 mm - this is the slice thickness of the scan. Type in "105.5" and then hit enter. You should see the image jump to this slice.
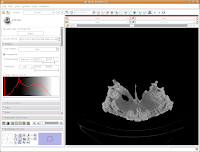
What if you want to zoom in a little? By clicking and dragging with your right mouse button, you can accomplish this. Zoom in on the endocranial cavity, the gray-filled area at the center of the skull. If you need to pan around the image, click and hold the middle mouse button (a wheel on many mouses) while dragging. This will move the image, and you can reposition it as appropriate. If you just move the mouse wheel, you'll cycle back and forth through the slices. Give it a try, and see what happens!
To return to the original view, find the little button just to the left of the slider bar. If you hover your mouse over it, it should say "Displays a menu of more options for the Slice Viewer." Click on it, and select "Fit to Window." And now, you're back where you started!
The current slice is in an "axial" section (actually, coronal, if going by the proper anatomical planes). What if you want to see another view? The easiest option is to go up to tool bar again, and back to that button that pops up with a menu that says "Choose among layouts for the 3D and slice viewers." You can select "Yellow Slice only layout" or whatever your heart desires. You may have to "Fit to Window" again, to get it all in screen.
For the next phase of the tutorial, go back to the "Red Slice only layout," and fit it to the window.
Here ends the second part of the tutorial. In the next post, we'll learn how to segment the data.
Looking at the Data
One of the really nice things about Slicer is that it automatically shows the image with three orthoganal slices. These should appear in three little windows in the lower right of your Slicer screen.

You'll notice that the images are a little small, and that they look a little washed out. Never fear, there are ways to fix this! Let's take care of them one at a time.
In order to resize the images, mouse across the toolbar at the top of the screen, until you see the button that pops up with a menu that says "Choose among layouts for the 3D and slice viewers." It looks like a little mini version of the Slicer screen. Click on it, and select "Four-up layout". This shrinks the lavender winder (the 3D window that will eventually display your model) and makes the CT slices bigger.

Next, go to the same menu and select "Red slice only layout." Now, the view in the red slice should fill the whole screen. Get the idea? We'll leave it in the current view for now.

Next, let's take care of the washed-out look of the CT slice. This is a problem fixed by adjusting the windows and levels. Essentially, this is a fancy CT imaging trick akin to adjusting brightness and contrast of a picture in Photoshop (or GIMP). To play with this, go to the toolbar at the top again, and find the drop-down menu net to "Modules:". Under this menu, click on "Volumes." A new interface pops up on the left side of the screen, and we can get down to business.

The important part of this multi-layered interface is labeled "Display." So, click on this. If you have to, scroll down so that the whole "Display" module is in view.

Now, you'll see a little slider beneath the row that says, "Window/Level". Click and drag with your mouse on this slider to start changing the windows and levels. As you do so, you should note the CT slice at left changing. If you click on one of the window/level handles, you can drag it around to the left or right (on either slider). If you click on the space between the two sliders and drag, you'll move both sliders together. If you don't feel like all this stupid GUI stuff, you can just type values in the boxes above the sliders. In the end, I liked what I saw at 4451.4,1507.5. The shades of black were distinctive on my monitor, and I saw nice contrast between the fossil bone and matrix.

Let's play with the data! To move back and forth through the stack of images, move the slider above the CT image. You'll see the visible images change forward and backward through the skull. Pretty cool, huh? The number at right tells you how many millimeters you are through the image, from the midpoint of the stack. Notice that as you move the slider, the numbers move by increments of 1.25 mm - this is the slice thickness of the scan. Type in "105.5" and then hit enter. You should see the image jump to this slice.

What if you want to zoom in a little? By clicking and dragging with your right mouse button, you can accomplish this. Zoom in on the endocranial cavity, the gray-filled area at the center of the skull. If you need to pan around the image, click and hold the middle mouse button (a wheel on many mouses) while dragging. This will move the image, and you can reposition it as appropriate. If you just move the mouse wheel, you'll cycle back and forth through the slices. Give it a try, and see what happens!

To return to the original view, find the little button just to the left of the slider bar. If you hover your mouse over it, it should say "Displays a menu of more options for the Slice Viewer." Click on it, and select "Fit to Window." And now, you're back where you started!
The current slice is in an "axial" section (actually, coronal, if going by the proper anatomical planes). What if you want to see another view? The easiest option is to go up to tool bar again, and back to that button that pops up with a menu that says "Choose among layouts for the 3D and slice viewers." You can select "Yellow Slice only layout" or whatever your heart desires. You may have to "Fit to Window" again, to get it all in screen.
For the next phase of the tutorial, go back to the "Red Slice only layout," and fit it to the window.
Here ends the second part of the tutorial. In the next post, we'll learn how to segment the data.
Monday, December 1, 2008
3D Slicer: The Tutorial
Every once in a great while, a program comes along that completely changes the way you do things. For me, this program was 3D Slicer. I remember the early stages of the "CT Revolution," when CT reconstruction required $10,000 worth of software and $4,000 worth of hardware. Heck, this attitude even persists today with some folks! When I started on my dissertation, which was going to require a lot of CT analysis, I knew I either had to get a whole lot of money fast, or else find a free alternative. 3D Slicer came along at just the right time.
3D Slicer is an open source, 3D reconstruction package that is intended to work with tomographic data of all types - particularly CT and MRI. It excels at making high-quality surface reconstructions (although a volume rendering module is nearing maturity, too), volumetric measurements, and all other sorts of things. Oh yeah, and it's FREE. Slicer became the workhorse for my dissertation (and many others at my graduate institution).
The documentation was pretty incomplete (and still is, in some areas) when I started with Slicer. So, I spent long hours of just trying to load data and get a simple model. Things are better now, but because Slicer is geared for the biomedical crowd, most of the tutorials for the program that are available on-line follow biomedical examples. So, I decided to put together a Slicer tutorial that would benefit paleontologists.
The present tutorial, issued in a series of posts, follows a paleo-oriented example for using Slicer version 3.2, the latest official release. Version 3.3 is available in alpha form, and no major changes in the interface are evident. So, you should be able to follow this regardless of your version. Note that the 2.X series has a pretty different interface, although many of the fundamentals are the same (even if you have to look under different menus or toolbar buttons).
The screenshots used here were taken from the October 1, 2008 build of Slicer 3.2, running under Ubuntu Linux 8.04. But, all of the gizmos and gadgets should run just the same under Windows or the Mac OS.
Let's get started!
Starting Assumptions
This tutorial assumes that you (the reader) have some measure of computer competency - you know how to install programs, unzip files, and the like. It also assumes that your computer has enough processing power to handle the data sets. Memory, rather than processing power, is the important thing - you'll probably want at least a gig of RAM, and more is always better.
Getting Slicer
Visit the Slicer Download page, for a whole set of instructions and options. New users probably want to get a Stable Release, but those who want the latest bleeding-edge features should opt for a Nightly Build or Snapshot. Most operating systems are represented (Mac, Windows, Linux, and Solaris). As mentioned above, you'll want at least Slicer 3.2 for the purposes of this tutorial.
Getting an example data set
The dataset used in this tutorial is that for AMNH 5405, a Euoplocephalus skull. These data have been generously posted to the web by Larry Witmer, available here. To begin, download the data and unzip them in the directory of your choice. In my case, I put them on my Desktop in my home directory, and renamed the folder to AMNH5405.
Starting Slicer
Depending on how you installed Slicer, you may access it from the Windows menu, or the folder into which you installed it, or some other place. In my case, I have it installed into a folder called Slicer3.2, in my home folder. In order to start Slicer, I open the folder and double-click on the "Slicer3" icon. The program starts up with a friendly welcome screen, while various modules are loaded, and then you see the blank user interface - no data are loaded yet.
The screen shots accompanying the tutorial from here on out will appear just after the relevant steps.

You'll note that as you move your mouse around, various context helps come up to indicate what each icon does. Because this is a "bare bones" tutorial, we'll only be looking at the ones needed for the task at hand.
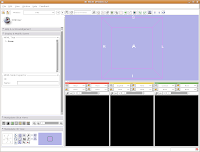 Loading Your Data
Let's dive right in! The first step is to load the CT data that we want to reconstruct. There are one or two ways of loading data, but let's go with the simplest. Under the "File" menu, choose "Add Volume." Now, a new window appears, with your directory structure on the left and a list of files on the right. In the left part, navigate to the directory that contains your data (AMNH5405, in this case). Click on it, and then you should see a whole list of DICOM files. Click on the one at the top of the list, and then hit the "Apply" button at the bottom of the window.
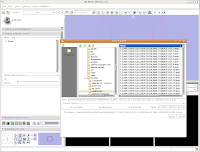 Wait patiently as the data are loaded - depending on the speed of your machine, this may take a little while. It took about 13 seconds on my relatively high-powered computer. Now, you should see your data!
 Here ends the first part of the tutorial. The next post will continue with "Looking at the Data."
Subscribe to:
Posts (Atom)