Sunday, March 29, 2009

Finding that PDF

Unfortunately, not everyone has access to a massive research library (or in some cases, any research library at all). Yet, the literature is an essential part of any paleontologist's repertoire. In this post, I'll briefly review some options out there for locating free or low-cost scientific publications on the web.
  • Google Search: Sometimes, all it takes is a quick Google search to find a paper. For instance, say I'm looking for Marsh's old paper on characters of Odontornithes. I type "Characters of the Odontornithes, with notice of a new allied genus" into the old Google search box, and what do you know? It gives me a link to Matt Wedel's archive of O.C. Marsh papers! Sometimes, of course, you might have to try a few variants on a search before you hit on the right PDF. Often, when I'm doing initial research on a topic, I'll type in "[taxon or topic name here] pdf". You never know what you might find! For instance, typing "Triceratops PDF" gave me a link to several very relevant papers. Google Scholar also works pretty well in this regard (and will often filter out most of the non-scholarly stuff).
  • Google Books: I have had some real success, particularly with older works, on this search engine. I strongly recommend setting the search settings to only find books with "full view," if you're not interested in just snippets of text. Once the recent settlement with publishers gets worked out, I think we can expect some really good things in terms of low-cost access to out-of-print but in-copyright publications.
  • Scribd: This website offers browsable documents for a surprising number of paleontological papers, although you must be a registered user (free) to download PDFs.
  • Journal Archives: Many museum publications, such as Fieldiana and all of the AMNH publications, are available online. It's always worth checking out museum web pages to see if their old publications are out there. A number of journals also have freely available archives. 'Nuff said.
  • Author's Web Page: More and more scientists have PDFs of their papers on their web page - so, it's always worth a quick search to see what's available.
  • Writing the Author: If you can't find the PDF for a recently published article through other means, send an email to the author. As I mentioned in a previous post, it's a great ego boost for those of us who write scientific papers!
Of course, these suggestions probably aren't news to some of the more experienced paleontologists out there - but I do hope this is useful for those just beginning in the field. What other sites do you find particularly useful for this sort of background research?

Disclaimer: It is entirely up to the user to be aware of any copyright restrictions that may apply to the download or use of any of the resources addressed here.

Update:
Dave Hone has posted a really nice continuation of this theme over at his blog.

Monday, March 23, 2009

Bone-ing Up on Allometry

ResearchBlogging.orgAllometric scaling - roughly defined, when different parts of an organism grow at different rates - is an important factor in biology. In part, allometry describes how babies have relatively larger heads than adults (we exhibit negative allometry in this trait, because our skulls don't grow as quickly as the rest of the body) or how some crabs have gigantic claws (an example of positive allometry, in which the claw grows much faster than the rest of the body). Allometry (and its counterpart isometry, in which proportions don't change at all) can be examined on an intraspecific level, such as the example in humans, or on an interspecific level.

It's not cute - it's allometric!
Toronja Azul, Chihuahua Puppy, 5 August 2007 via Wikimedia Commons, Creative Commons Attribution 2.0


For paleontologists and biologists, allometry and isometry are particularly interesting when it comes to understanding groups with large ranges in body size. When you grow a Tyrannosaurus from an Eoraptor-like ancestor, what has to change in order to support the body mass? Sometimes it's postural - big animals tend to have more "columnar" posture (with the supporting legs straight beneath the body) and small animals tend to have more "flexed" posture. In other cases, it's allometric - big animals might tend to have relatively thicker bones than small animals. Sometimes, it might even be both. And sometimes, none of these comfortable patterns seem to fit perfectly.

Looking at Cats
Regardless of the patterns (and often because of them), scaling studies of limb bones have attracted a lot of ink over the years. A recent contribution, authored by Michael Doube and colleagues, appeared the other week in the open access journal PLoS ONE. Their paper, entitled "Three-dimensional geometric analysis of felid limb bone allometry," takes a novel peek at how different limb bones scale within cats. Cats are a particularly interesting study subject, because they span a range of adult body masses - from as little as 3 kg in the domesticated cat to 306 kg in the largest tiger.

Domesticated cat (left) and lion skeletons, scaled to roughly the same height at the shoulders.

Limb bone allometry in its own right is an interesting, but rather conventional, topic. Most studies are content to take some linear measurements, or perhaps a cross-section or two, for a range of species. Doube and colleagues did something unique - they examined the three-dimensional properties of entire limb bones, as well as two-dimensional properties in series along the entire bone, using CT scans coupled with custom-written software macros.

The macros (which are one of the really cool things about this paper, and a big reason for why I'm highlighting it here) calculate a variety of cross-sectional properties automatically from CT scan data. Previous macros (such as the very useful MomentMacroJ) required a human operator to do things one slice at a time. Believe me, this can take forever for a limb bone data set of 200 CT slices. The authors of the paper in question were able to quickly and efficiently assemble data sets for a variety of measurements from a variety of limb bones for a variety of felid species - over 16,000 CT slices in total! So, this allowed compilation of a database for measurements throughout the bone - not just at the boring old mid-shaft. Furthermore, they calculated joint geometries (through a sphere-fitting routine, to approximate surface area of certain joints) as well as moments of inertia for entire bones.

This data set allowed the authors to get one of the the most complete pictures of limb bone properties ever assembled. In general, cross-sectional properties at mid-shaft (a standard location for measurement) did not differ significantly from isometry (i.e., big cat bones look the same as little cat bones). Of course, a larger sample might achieve statistical significance at P less than 0.05 (results are suggestive, but don't differ significantly from isometry). Interestingly, joint surfaces and moments of inertia tend to scale with positive allometry. In other words, big cats have relatively bigger joints and beefier bones (a more thorough and accurate explanation of moments of inertia is beyond the scope of this post) than do small cats.

So why are these results interesting? Well, it appears that cats "get big" differently from other animals. Whereas comparably sized mammals tend to change from flexed limb postures to more columnar limb postures as body size increases, cats apparently maintain a relatively flexed posture across their size range. Instead, cats compensate for the change in body mass by beefing up their bones. Skeletal and postural responses to increased body size are pretty darned diverse, and there is no "one size-fits-all" solution. It will be very interesting to see broader applications of this methodology.

Open Source Solutions
The authors used ImageJ, an open source image processing system (detailed in a previous post here) for much of their data collection. The macro they wrote and used is also freely available with their paper--so feel free to try it out with your own data. Their massive datafiles were collated with MySQL, and the statistical analysis was conducted within R, using the SMATR package for regression analysis. So, it was an open source project from start to finish! As the cherry on top of the cake, publication in PLoS ONE means that the paper is easily and freely accessible to all. I've already made a few notes on the paper, with quick and gracious responses from one of the authors. If you have anything to add to the discussion, don't be shy!

Further Reading
If you're interested in more open source solutions to these sorts of problems, check out lead author Michael Doube's web page. He's got lots of macros, pretty pictures, and other goodies for enjoyment and download.

The Citation
Doube, M., Wiktorowicz-Conroy, A., Christiansen, P., Hutchinson, J., & Shefelbine, S. (2009). Three-dimensional geometric analysis of felid limb bone allometry. PLoS ONE, 4 (3) DOI: 10.1371/journal.pone.0004742

Sunday, March 15, 2009

Lizard Skulls! (the update)

In a previous post, I noted a really nifty collection of digital lizard skulls available thanks to the efforts of Nick Gardner, writer of "why I hate theropods" and a student in the Casey Holliday lab. Well, it turns out that I jumped the gun just a little bit (thanks for nothing, Facebook!). . .the complete director's cut of the page is now available, and is highlighted in a posting here. Congratulations on a really great resource!

Thursday, March 12, 2009

Two Items

First, congratulations to Dr. Mark Loewen, who successfully completed his dissertation defense on Tuesday afternoon. His dissertation focused on variation in Allosaurus, and was truly an epic piece of work.

Second, check out this paper that just came out in PLoS ONE. The paper covers some interesting aspects of limb bone allometry (shape changes with size), and provides open source macros for ImageJ, so you could do similar analyses on your own dataset. In the next day or two, I should have more to say, but for the time being check out the link. . .as always, the papers are free to download, and please take advantage of the commenting/note-making/rating features on the PLoS website.

Doube M, Conroy AW, Christiansen P, Hutchinson JR, Shefelbine S (2009) Three-Dimensional Geometric Analysis of Felid Limb Bone Allometry. PLoS ONE 4(3): e4742. doi:10.1371/journal.pone.0004742

Thursday, March 5, 2009

3D Slicer: The Tutorial Part VI

Nick (of why I hate theropods) posted a question today on this blog, asking if there was a way to save models from Slicer as STL files. So, here's a quick post explaining how to do just this.

Why would you want to do this, if there's a perfectly good VTK-format model exported by Slicer already? Well, VTK is an industry standard that is good for many open source software packages, but most commercial packages don't deal well with the format. So, STL ("stereolithography") files are a happy medium. STL format has its own issues, but is nearly universally read by computer modeling programs.

In order to get a start on exporting STL's from Slicer, let's return to where we picked up from the last tutorial. Load all of your files (you saved the model and label map after the last tutorial, right?). This should give you the brain in the middle of the 3D viewer. For some unknown reason, say you want to export this brain as an STL for post-processing in another program. Luckily, it's a relatively easy thing to do!

First, switch to the "Models" module, by selecting under the "Modules" drop-down menu.
Then, click on the "Save" tab, to expand this option. Hit the "Save Model" button.

A dialog box comes up, and you can choose an alternative from the default (VTK) under the "Files of Type" option. In this case, select "STL."
Choose the name and location for your file, hit save, and you're done!

Wednesday, March 4, 2009

PLoS ONE's newest editor

It's official. . .I have just accepted an invitation to join the editorial board for the on-line, open access journal PLoS ONE. With its recent burst of vertebrate paleontology articles (featured prominently in their Paleontology Collection), the future is looking quite bright. I am very eager to assist the open access movement in a more concrete way, for a journal that is making many positive changes to the way research is communicated. Other vertebrate paleontologists on the editorial board include Tom Kemp, Paul Sereno, and David Unwin (and my apologies to anyone else I neglected to mention).

So. . .bring on the manuscripts!

Tuesday, March 3, 2009

Crouching Theropod, Hidden Dragon

ResearchBlogging.orgFossil footprints (falling in the general category of "ichnofossils") reveal a wealth of information about dinosaur biology, such as speed, posture, and behavior. These traces are particularly useful when offering information independent from, but consistent with, hypotheses derived from purely anatomical studies.

Today, a new paper in the open access journal PLoS ONE presents an unusual set of theropod (meat-eating dinosaur) ichnofossils from the Early Jurassic-aged Moenave Formation of southwestern Utah. The tracks are preserved within the St. George Dinosaur Discovery Site at Johnson Farm, a massive facility housing thousands of footprints (for additional scientific publications and background on the site, refer to this page). But, if there are thousands of footprints known at the site (in addition to the thousands known from other sites throughout the world), what makes the fossils featured in the paper so special?

Theropods were bipedal animals, and known ichnofossils typically only preserve evidence of the hindlimb. But, one specimen in particular at the St. George locality preserves impressions of the hind feet, forefeet, and the rear end of a lazy carnivore. A resting trace!

Artist's conception of the St. George trackmaker at rest. Note in particular the resting posture and the orientation of the hands. From Milner et al. 2009; painting by Heather Kyoht Luterman.

Yet, even resting traces aren't completely unheard of for theropod dinosaurs. The really interesting thing here is that the specimen preserves relatively unambiguous impressions of the hand posture. The animal was resting with its hands turned inward, and the outer surfaces of the fingers and wrist (rather than the palms) touching the substrate.

Why does this matter? Well, it all has to do with reconstructions of forelimb mobility and posture. Old reconstructions of theropod dinosaurs showed them walking around with palms down (think of an alligator dragged upright); later work has strongly suggested that the palms faced inward, more like birds.

Traditional restoration of two theropods, by Charles R. Knight. Note the palm-down, rather than palm-in, posture of the hands.

So, the new St. George tracks are the first good ichno-evidence of forelimb posture in theropod dinosaurs. Furthermore, and perhaps most importantly, it suggests that this posture evolved pretty early on, in some of the first theropod dinosaurs.

As the authors note, anatomical reconstructions of forearm movement have primarily focused on more "derived" theropods (animals from the Late Jurassic and beyond). It would be really, really nice to get additional studies on the anatomical structures of the forelimb in animals like Dilophosaurus and Coelophysis (Ken Carpenter did get a good start on this a few years back; see his 2002 paper, "Forelimb biomechanics of nonavian theropod dinosaurs in predation." Senckenbergiana Lethaea 82: 59-76). Also, paleontologists will want to be on the lookout for similar traces. Is the specimen described here typical, or an individual anomaly? The authors reviewed other alleged resting traces from theropods, but considered that most of them were either misidentified or too poorly preserved to offer usable information. Finally, does resting posture of the forelimbs necessarily reflect what the animals were doing the other 99 percent of the time?

Congratulations to the authors on a stimulating paper. If you have an opinion on this research, don't just post it in the blog's comment section (although please do that, too). Head over the the PLoS ONE website, and register your own comments, notes, and ratings on the article!

The Reference
Andrew R. C. Milner, Jerald D. Harris, Martin G. Lockley, James I. Kirkland, Neffra A. Matthews (2009). Bird-Like Anatomy, Posture, and Behavior Revealed by an Early Jurassic Theropod Dinosaur Resting Trace. PLoS ONE, 4 (3) DOI: 10.1371/journal.pone.0004591

Lizard Skulls!

Casey Holliday, a paleontologist and functional morphologist out at Marshall University, and Nick Gardner, an undergraduate at Marshall and owner of "why I hate theropods" (possibly my favorite title for a paleontology blog ever), have started posting a collection of virtual skulls.

These guys did a whole bunch of reconstructions of lizard skulls from CT scan data, and the recons are downloadable as 3D PDFs or VRML files. Check it out - it's a great way to get an appreciation for the diversity of cranial form in this group! And, look for more to come in the future.

Marshall University also has a nice article on the project.

Note: Keep an eye on Nick's blog in the coming days for more on the project.

Monday, March 2, 2009

Advice from a Nobel Laureate

This evening I attended a talk by Eric Cornell, who shared the Nobel prize in physics in 2001 for his work on the creation of the first Bose-Einstein condensate. The talk was accessible, entertaining, and engaging--a rarity in any field of science, let alone condensed matter physics.

During the question and answer period, a young woman in the front row (probably no more than 12 or 13 years old) asked what she should study if she wants to be a successful scientist. Dr. Cornell mentioned the usual suspects - take courses in math and science. And then he added - work on your writing! This is an important word of wisdom, and one that is often neglected.

Good communication skills are a foundation of science - if we can't share our work with friends and colleagues, and have them understand the research, what's the point? So, to all of you students out there, work on your writing skills! Practice writing, get honest critiques from someone who has the time and honesty to really hammer your work, and then learn from the experience. And, practice communicating your research through other methods--oral presentations, posters, email, and the Internet. Even today, after completing a Ph.D., I am still working on my communication skills--I suspect it will be a lifelong task!

Sunday, March 1, 2009

3D Slicer: The Tutorial Part V

Finally. . .the long-awaited continuation of our Slicer tutorial! As a reminder (or for those who are just joining us), 3D Slicer is an open source program designed to reconstruct and present three-dimensional datasets such as CT scans.

In the previous segments of the tutorial, we learned how to load data, view data, segment the data, and create a simple model. In this part of the tutorial, we'll explore some of the editing tools for more sophisticated segmentation. This section assumes that you're already familiar with the basic features of Slicer (essentially, those features outlined in previous posts). Thus, I'm going to gloss past some of the steps we've already covered (loading data, saving data, etc.).

Also, note that I'm using 3D Slicer Version 3.3 Alpha. I like working at the bleeding edge of the software, but the features I discuss should be pretty operational in version 3.2 or earlier. I did notice a bug with one of the tools (the change island tools) in the 3.2 alpha that I had, but this seems variable across operating systems. Most of you already know that I run my build of Slicer in Linux, but the tools are all the same if you're using Windows or Mac.

For ease of presentation, we'll switch datasets from the fossil ankylosaur of previous sections to a modern alligator with the flesh still attached. This specimen is just a little easier to work with as an example.

Note: If you experience issues with graphics (a white screen where a CT slice should be, for instance), experiences suggests that turning off graphical effects in your OS will solve the problem.

A New Dataset
First, download and extract the alligator dataset from the Witmer Labs web page. For ease of access and organization, let's create a folder to store all of our data files and CT slices--in this case, I'm calling my folder "gator." Place the CT data in there (Alligator_mississippiensis_OUVC9761_DICOM-data should be the folder name), and then we're ready to get to work.

As before, load the CT volume into Slicer (accessible through the File-->Add Volume menu).
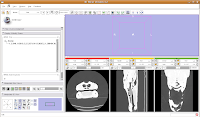
For ease of viewing, I changed the window and level settings under the Modules section of the toolbar, by selecting "Volumes". In the Volumes section that pops up, hit the display tab. Now, you can adjust the window and leveling options. I used settings of 1600/250 (you can type this in the dialog box). As you'll note, the bone and flesh will stand out more crisply now, versus the default settings.
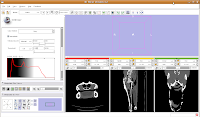
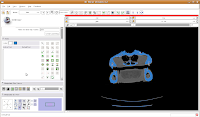
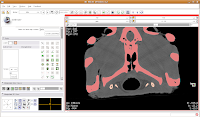
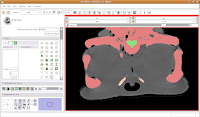
Now, let's switch to a single slice view, for the red slice (it's labeled as the axial slice here). Zoom in an appropriate amount, to get a better view of what's going on.
The white areas are bone and teeth, the gray areas are flesh (muscle, skin, fat, etc.), and the black areas are air. Note the nasal passages and sinuses in the middle of the skull. Areas of air elsewhere (such as in the lower jaw) are probably due to a mild amount of decomposition after the death of the animal (yes, this is only a severed gator head, not a live animal).

Now, move to the editor (as a reminder, you'll find it next to "modules" and start a new label map. In the box for "Name for label map volume," call it "gator." (I know, not very creative).
Next, let's threshold the label so that only the skull is highlighted. Click the "threshold" button, and adjust it to something that gives you a good picture of the bone. I found a lower setting of 300 and the default upper setting for the range did pretty well in my book.
Do note that if you're using your reconstructions to measure things like volumes, surface areas, etc., you'll want to be very careful about how you threshold (reasons behind this could fill another post altogether). For the purposes of our reconstruction to just show morphology, it won't make much of a difference.

Taking a New Path
So far, we haven't done anything new over the previous sections of the tutorial. You could create a model right now and have a nice gator skull to look at. But, what's the fun in that? Now, let's really take a look at the editing tools in Slicer.

Before we get started, let's save our work so far. This will guard against the annoyance of a glitch, crash, or unintended mouse click that could ruin our hard-earned segmentation efforts. I'm going to save the whole batch in that "gator" directory I created earlier, following the steps outlined a few posts back. Make sure to save both the scene and the data files.

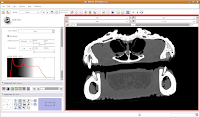
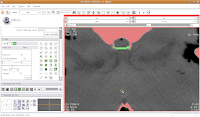
At this point, you may notice that part of the gantry is selected in our default blue color. If you were to make a model right now, this (and any other little bits of noise) would be rendered and obstruct our view of the skull itself. Fortunately, there is a really easy way to get around this: the "change island" tool.

In Slicer, an "island" is a group of contiguous pixels in a label map. All pixels of a single label color that touch each other in the three-dimensional image stack are part of this island. So, the "change island" tool works something like the paintbucket tool in Photoshop or GIMP. You can use it to quickly and easily change the color of a massive area! However, you much be careful that there aren't any "leaks" into an area you don't want filled.

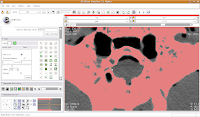
You'll find the "change island" button in the fifth row of the second column on the editor toolbar at the left side of the screen. Click on it, and some options will show up. First, let's change the label color to "5". This means that the blue label will change color to red. The other option, scope, can be left as is for now. Scope just tells you whether you want to fill across the entire label volume or just within a particular slice.
Once we've changed those options, click on a blue area within the jaw. Your computer will chug along for a few moments (the speed of the chugging depends largely on the speed of your processor--a faster computer is always better, regardless of what data analysis program you are using), and then you should notice a major portion of the label map turn red. The gantry and a few other isolated flecks remain blue (label map value "1").
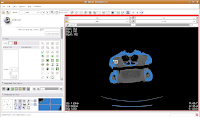
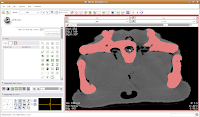
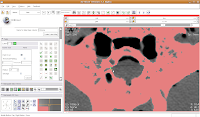
Next, go to location 60 (type it in the dialog box towards the upper right corner of the screen, and hit enter). Towards the bottom of the gator head, you'll see four blue areas. These are the hyoid bones. Let's segment them in a peach color (label map value "2"). It is helpful to zoom in a bit, to make click placement easier. As before, change the label color to "2", and click on each of the four islands of pixels, one at a time.
Your computer will chug along again, and then you should have the hyoids segmented out pretty nicely. It is a good idea to segment each segment of the hyoid individually--that is, wait for the color on one to change before clicking on the next. This will avoid disappointment if you make a poorly-placed click.
Now is a good time to save your hard work, before we move on to the next step.

Let's Make An Endocast!
If you're like me, you were first fascinated by CT scanning as a way to glimpse internal morphology or make renderings of anatomical structures. So far, everything we've done is interesting, but not much better than picking up a real specimen and turning it over in your hand. A great deal of research lately has centered on making digital endocasts of structures such as the brain, or sinuses, or neurovascular canals. Now, we're going to make a quick-and-dirty endocast of our alligator.

First, a brief digression. Making quality digital endocasts is a skill and an art, requiring anatomical knowledge as well as a bit of finesse. Give the same dataset to three different paleontologists, and I guarantee that you will get three slightly different versions of the endocast. It all depends on thresholding, patience, and interpretation. One of the real keys is practice--you will not necessarily get a research-ready endocast on your first attempt. As you gain experience, you'll quickly figure out where to draw the line for boundaries, etc. All of this will make a difference in the final reconstruction (and is an extremely underappreciated and underplayed aspect of those fancy figures you see in papers by me and the other CTers out there). In other words, your first attempt may not be pretty--but it's a step in the right direction!

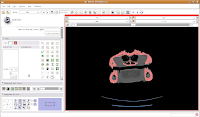
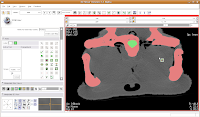
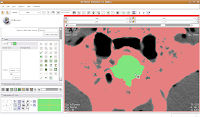
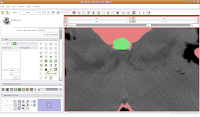
Ok, let's skip to slice 95. For now, we'll consider that to be the end of the endocranial cavity (not strictly true, but it works for this tutorial).

In the figure below, the mouse pointer is in the space of the endocranial cavity. This is what we're going to fill up to create a virtual brain (yes, yes, I know that the endocast is not synonymous with the brain - just deal with it!).
We're going to use the "change island" tool, with a twist. If we leave the scope for this tool at "All," we'll get a nasty surprise. The space of the endocranial cavity is, right now, contiguous with a whole lot of nothing. This means that trying to change everything at once would spill out into the entire label map, leaving a skull surrounded by a sea of "brains".

So, let's do things differently. Select the "change island" tool, and then change the color to 6 (green brains!). Next, change the scope to "visible". This means that only the slice currently in view will be affected. Move to the endocranial area, cross your fingers, and make a click.
If all goes well, this little area will turn green! We're on the road to a gator brain.
Hit the back arrow to move to the next slice. Repeat as before, for another two or three slices.

Tedious, huh? It would be really nice to find a way to automate the process. Well, now we can think about using the change island tool in a modified way. As you'll recall, we need a closed contiguous area of pixels in order to avoid brain spillage. But, the endocranial cavity is full of holes! In order to get around this, we'll create a "dam" of pixels.

One side of the dam is already in place. We'll just have to create the other side, now. As you scroll back through the brain, you'll find that it's a happy isolated space until slice 85 or so.
So, isolate this space. Now, scroll forward to slice 88 or so. Change the scope to "All," and click in the middle of the endocranial cavity. Once again, things will chug along for a bit. Once it's done, you can scroll back and forth and notice that the areas you had left blank are now filled in. How cool!
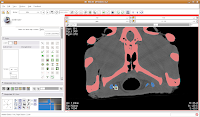
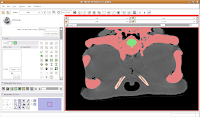
Now, let's turn our attention to slice 84. On the left side, you'll notice a little squiggly canal heading away from the endocranial cavity. In some cases, you might want to keep it. But for now, those sorts of things are just extraneous annoyances.

Introducing the Paint Tool
Zoom in to the endocranial cavity, and drag it so that it's at the middle of the screen (using the right mouse button and the mouse wheel, respectively). Now how are we going to keep the change island tool from filling into that canal?

Our answer is the Paint Tool. You'll find it in the editor toolbox, first column and third row. Click on the tool to select it. Now, if you move your mouse pointer across the slice, you'll see a big, big radius of effect. Not what we want!
So, let's change the radius of our paintbrush. On the left side of the screen, you'll see a tool just for that. You can click on it and drag to move by integers, or enter a decimal value (in millimeters). For this slice, I found a radius of 0.25 or 0.5 to be pretty good. So, type this in the dialog box. Now, when you move the pointer over to the slice, you'll notice that the area of effect is much, much smaller.
To block off this area, now just click and drag along the area you wish to enclose. Once you release the mouse button, you'll notice that a little green section is now in place.
If you made a mistake, just hit the "undo" button in the lower right corner of the editor toolbox.

Now, select the change island tool, and make sure it's set to "visible." Click within the area of the endocranial cavity, and you'll notice that our green brain goo stays confined to the area we want!
Making Some Progress
As you've probably noticed, the paint tool is perhaps a little haphazard for some processes. Sometimes you might accidentally overwrite part of the skull (the red colored label). In this case, just uncheck the "paint over" option. Nice and neat!

Continue on, filling in holes at the edge of the endocranial cavity up until slice 34 (for the last few, you'll have to delineate the entire bottom of the cavity).
Then, go back and use the change island tool to fill in all of the slices for the brains. Once you've done that, save your work.

Modeling Your Efforts
Now, let's make an endocast! As a shortcut, click on the "MakeModel" button (seventh row, second column). Under name, type in "Brain" and then hit "Apply."
This will create a model for the label map currently selected (in this case, the #6 green). The model maker will run in the background for awhile--you'll see a little progress indicator at the bottom of the screen.

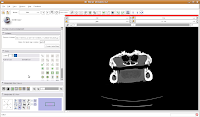
Once the model maker is done, change the view to "3D Only Layout" (using the fourth buttom over from the right, at the top toolbar).
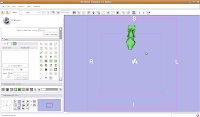
If you're lucky, you'll see your first digital endocast! If the model isn't visible, it's probably because it is still processing. Once the model shows up (this might even take up to a minute or two), you can click and drag to change the orientation.
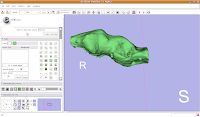
Finishing Up
Once again, save all of your work. Your model will be saved along with the label maps, and then you can take a well-deserved break!

Here ends part V of the tutorial. In the next part, we'll take a look at some ways to visualize your endocast in relation to the rest of the skull.