Showing posts with label data analysis. Show all posts

Thursday, January 28, 2010

Where is paleontology?

Last week, many of the leading journals in evolutionary biology - including The American Naturalist, Molecular Ecology, Journal of Evolutionary Biology, Evolution, and a number of others - announced a data archiving policy. In short, this policy states that the data behind the results of a paper should be publicly archived in well-known respositories such as Data Dryad, GenBank, or TreeBASE. Do you notice anything missing in this illustrious list of publications?

Not a single one of those journals explicitly focuses on paleontology. Last time I checked, we paleontologists like to think of ourselves as evolutionary biologists. Time and time again, we lament how we're not allowed a place at "The High Table" of evolutionary thought, and how paleontology is viewed as largely irrelevant by the "people who matter." So why weren't any paleontology publications on this list? Will we see any on the list in the near future?

The article in The American Naturalist gives a good run-down of the arguments for sharing data, so I'll only briefly summarize them here:
  • It allows reproducibility of analyses.
  • It allows others to build upon your work more easily.
  • Papers that release their data may get cited more frequently.
  • The data will be lost to science otherwise.
  • It's the right thing to do.
And to counter some potential objections:
  • This would only request the release of data directly relevant to the study. Not your pages and pages of raw notes. Just that Excel spreadsheet that you already generated on your way to the analysis. Seriously. It's not a lot of extra work, if any.
  • This is not requesting the digitization and distribution of video, CT scan, or similarly large and unwieldy data (although that would be nice in the future).
  • No, it does not mandate the release of locality data, or similarly privileged information.
  • The policy does not require immediate release of the data, if there's a good reason (i.e., another pending publication) to do so. I'm not sure I entirely support this (if you're publishing the analysis, you should publish the data), but I understand it as a necessary compromise to get more individuals on board. I won't let the perfect be the enemy of the good.
Some of the most ground-breaking and high-profile work in paleontology is happening on account of large meta-analyses of data pulled together from the literature - largely thanks to efforts like the Paleobiology Database. This work has real implications for big questions facing our science and our world: Climate change. The pace of evolutionary radiations. The origins of modern biological diversity. These sorts of databases focus primarily on geographic, stratigraphic, and taxonomic data - but think how much more powerful they could be if all of the morphological data ever published were available! Or if the PBDB volunteers didn't always have to transcribe the information from a PDF file. And look at the great strides that molecular biology has made with the ready availability of sequence data on GenBank! This would not have happened with a mentality of data hoarding.

Look. Amateur hour is over. If we want to play in the big leagues, we have to start acting like a real science. Real science is reproducible. Real science is data-driven. Real science involves sharing data. Yes, I know it's hard. It's new. We haven't done things this way before. There are potential problems. Not everyone is adopting it quickly. But if we always wait five years to "see what happens," we paleontologists quite frankly don't deserve a place at the High Table. Let's be leaders, not followers.

References
Piwowar, H. A., R. S. Day, and D. B. Fridsma. (2007). Sharing detailed research data is associated with increased citation rate. PLoS ONE 2(3):e308, DOI: 10.1371/journal.pone.0000308.
Whitlock, M., McPeek, M., Rausher, M., Rieseberg, L., & Moore, A. (2010). Data archiving. The American Naturalist, 175 (2), 145-146 DOI: 10.1086/650340

For previous posts on data sharing in paleontology, see here and here. Want to get involved? Spread the word. Talk to your local journal editor. Let the people who count know what you think.

Monday, January 19, 2009

Welcome, Longhorns!

I hear from a reliable source that your Digital Methods in Paleontology course has this blog listed as a recommended website for some supplemental readings. So, to all of you UT Austin students, welcome! I hope that the content here is at least somewhat useful. . .don't hesitate to post if you have any questions or comments. I (and my readers) are particularly eager to hear if you run across any other good software tools that aren't listed here, or if you have your own feedback on some of the software I've reviewed previously.

Your first reading assignment (if I'm reading the syllabus correctly) is found here. . .it gives some good background info on the blog. If you're completely bored, I would strongly recommend this post as a logical follow-up. Despite the name of this blog, I am not an open source zealot, and the referenced post gives some of the pros and cons of using open source software. Don't know what open source software is, exactly? This page is as good as any for a succinct introduction to the concept.

Good luck in the coming semester, and enjoy the class!

Friday, January 16, 2009

Workshop for the Digital Paleontologist

If you're a grad student interested in using mathematical techniques in your paleontological research, this workshop is for you! John Alroy and colleagues are presenting the fifth annual Paleobiology Database Summer Course in Analytical Paleobiology, hosted at the campus for the University of California's National Center for Ecological Analysis and Synthesis in Santa Barbara.

The rest of this post is taken directly from the announcement to the VRTPALEO list by John Alroy. I never had the chance to participate in this workshop (field season and all, and then I was too old of a grad student), but wish I had!

About the course
Since 2005 the Paleobiology Database has conducted a five-week intensive course in analytical paleobiology at the University of California's National Center for Ecological Analysis and Synthesis in Santa Barbara. In 2009 the course is scheduled to run from 30 June to 4 August, following NAPC. It will be supported primarily by the Paleontological Society with additional contributions from NESCent, the Palaeontological Association, and the Society of Vertebrate Paleontology.

Topics will include community paleoecology, quantitative biochronology, diversity curves, speciation and extinction, phylogenetics, phenotypic evolution, and morphometrics. Both simulation modelling and data analysis methods will be employed. The course will combine lectures and labs. Students will be given hands-on instruction in programming using R and trained in other analytical software. In addition to the course coordinator, each week a new instructor will be present. The instructors are expected to be John Alroy, Gene Hunt, Tom Olszewski, Pete Wagner, and Mark Webster.

There is no fee for registration, and students will be housed for free in apartments on the UCSB campus. Students are urged to apply for travel funds from their home institutions. If such funds are not available, travel expenses may be reimbursed for up to $400 if coming from the United States, $600 if coming from Western Europe, or $800 if coming from other countries. Students are responsible for meal expenses. There are no other charges of any kind, and no other major expenses are likely.

How to apply
Participating students should be in the early stages of their own research in any area related to paleontology. They should have a background in basic statistics, and preferably also programming. The ability to understand rapidly spoken English is essential. The course is open to undergraduates and advanced graduate students, but first or second year graduate students are particularly encouraged to apply. We also strongly encourage applications from women, minorities, and international students. Applications from professionals who have completed their studies will be considered, but strong preference will be given to students.

Applications should be submitted in PDF format to John Alroy (alroy@nceas.ucsb.edu). The review process will begin on 15 February 2009, and applications received by midnight Pacific time on that day will receive priority. Applications should consist of a one page statement. Do not include separate documents such as a curriculum vitae. No form needs to be filled out.

The statement should include a brief description of current research plans, a list of degrees earned stating the year of graduation in each case, a brief list of relevant classes taken, and an account of the student's previous use of statistics and programming. Students who do not employ English as a primary language should describe their experiences learning and speaking it. Applicants are encouraged to explain why the topics addressed by the course are of special interest to them, and which of these subjects are taught at their home institutions.

Applications must be accompanied by a recommendation letter, also in PDF format, written by the student's academic advisor and e-mailed separately. Obtaining a recommendation from anyone who is not an advisor must be explained. It is important that the recommendation give details about the applicant's personal character and abilities, not just credentials and descriptions of research projects. Recommendation letters also must be received by the end of the due date.

Tuesday, December 2, 2008

3D Slicer: The Tutorial Part II

In the previous post in this series, we got started with using Slicer. So far, we've opened up a stack of DICOMs, and are ready to get to work. In this post, we'll learn how to take a look at the slices.

Looking at the Data
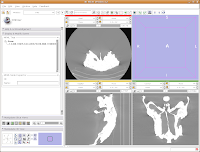
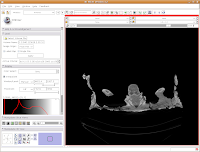
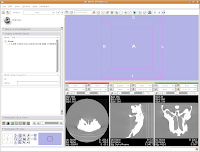
One of the really nice things about Slicer is that it automatically shows the image with three orthoganal slices. These should appear in three little windows in the lower right of your Slicer screen.

You'll notice that the images are a little small, and that they look a little washed out. Never fear, there are ways to fix this! Let's take care of them one at a time.

In order to resize the images, mouse across the toolbar at the top of the screen, until you see the button that pops up with a menu that says "Choose among layouts for the 3D and slice viewers." It looks like a little mini version of the Slicer screen. Click on it, and select "Four-up layout". This shrinks the lavender winder (the 3D window that will eventually display your model) and makes the CT slices bigger.

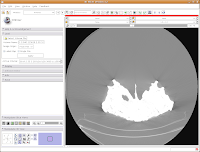
Next, go to the same menu and select "Red slice only layout." Now, the view in the red slice should fill the whole screen. Get the idea? We'll leave it in the current view for now.

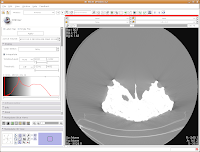
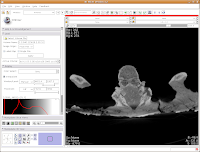
Next, let's take care of the washed-out look of the CT slice. This is a problem fixed by adjusting the windows and levels. Essentially, this is a fancy CT imaging trick akin to adjusting brightness and contrast of a picture in Photoshop (or GIMP). To play with this, go to the toolbar at the top again, and find the drop-down menu net to "Modules:". Under this menu, click on "Volumes." A new interface pops up on the left side of the screen, and we can get down to business.

The important part of this multi-layered interface is labeled "Display." So, click on this. If you have to, scroll down so that the whole "Display" module is in view.

Now, you'll see a little slider beneath the row that says, "Window/Level". Click and drag with your mouse on this slider to start changing the windows and levels. As you do so, you should note the CT slice at left changing. If you click on one of the window/level handles, you can drag it around to the left or right (on either slider). If you click on the space between the two sliders and drag, you'll move both sliders together. If you don't feel like all this stupid GUI stuff, you can just type values in the boxes above the sliders. In the end, I liked what I saw at 4451.4,1507.5. The shades of black were distinctive on my monitor, and I saw nice contrast between the fossil bone and matrix.

Let's play with the data! To move back and forth through the stack of images, move the slider above the CT image. You'll see the visible images change forward and backward through the skull. Pretty cool, huh? The number at right tells you how many millimeters you are through the image, from the midpoint of the stack. Notice that as you move the slider, the numbers move by increments of 1.25 mm - this is the slice thickness of the scan. Type in "105.5" and then hit enter. You should see the image jump to this slice.

What if you want to zoom in a little? By clicking and dragging with your right mouse button, you can accomplish this. Zoom in on the endocranial cavity, the gray-filled area at the center of the skull. If you need to pan around the image, click and hold the middle mouse button (a wheel on many mouses) while dragging. This will move the image, and you can reposition it as appropriate. If you just move the mouse wheel, you'll cycle back and forth through the slices. Give it a try, and see what happens!

To return to the original view, find the little button just to the left of the slider bar. If you hover your mouse over it, it should say "Displays a menu of more options for the Slice Viewer." Click on it, and select "Fit to Window." And now, you're back where you started!

The current slice is in an "axial" section (actually, coronal, if going by the proper anatomical planes). What if you want to see another view? The easiest option is to go up to tool bar again, and back to that button that pops up with a menu that says "Choose among layouts for the 3D and slice viewers." You can select "Yellow Slice only layout" or whatever your heart desires. You may have to "Fit to Window" again, to get it all in screen.

For the next phase of the tutorial, go back to the "Red Slice only layout," and fit it to the window.

Here ends the second part of the tutorial. In the next post, we'll learn how to segment the data.

Wednesday, October 8, 2008

Head Butting Goats: Part I

This post is slowly getting written. . .SVP talk preparation and other commitments take away blogging time! Anyhow, here's part I. . .

Farke, A. A. 2008. Frontal sinuses and head butting in goats: a finite element analysis. Journal of Experimental Biology 211: 3085-3094. doi: 10.1242/jeb.019042

To get a PDF of this paper, try this link first. If it doesn't work, email me at andyfarke [at] hotmail [dot] com, and I'll send you a (legal) link for a free download.

You're a Paleontologist - Why Head Butting in Goats?
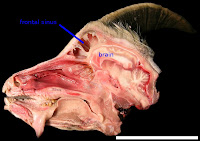
This paper is all about the dinosaurs, really! Years ago (when I was in high school, in fact, back in 1996), I read an article by Cathy Forster on skull anatomy in the horned dinosaur Triceratops. She speculated on the function of these sinuses (hollow spaces above the brain and below the horns), noting some similarities with horned mammals such as bighorn sheep. Sheep and many of their relatives also have these massive sinuses in their skulls (see image at left) - some researchers posit that the sinuses serve as shock absorbers. The sinuses then protect the brain from being rattled around during horn-to-horn combat. Cathy (and others) thus inferred that because sheep have sinuses, and the sinuses are shock absorbers in these animals, then the sinuses of Triceratops are also probably related to shock absorption. Cool idea, huh?

But, I noted one problem: nobody has ever demonstrated that the sinuses of sheep, goats, and their relatives actually act as shock absorbers! It's one of these nice "truths" that remained untried. So, I decided to test this as one small part of my dissertation work on skull function in horned dinosaurs.

Methods to the Madness
How do you investigate head butting in a living animal? One path is to wire up the bone of the skull with strain gages, which measure the deformation of the bone during an activity. This didn't appeal to me for a few reasons: 1) It would be messy and invasive in living animals; 2) it would be just plain messy in dead animals; and 3) there was really no good way to experimentally manipulate the skull anatomy to test the effect of adding or removing sinuses. In all seriousness, it was point 3 that proved the most problematic.

The solution: computer modeling. Specifically, I used a technique called finite element analysis, or FEA for short. In brief, FEA allows you to model the physical "behavior" of a complexly-shaped structure under given conditions. For this study, it was a goat head under a load to the horns. So, what's so good about a computer analysis, over a "real-world" experimental approach? Most importantly, I could really, truly manipulate the skull anatomy. In order to measure the effect of sinuses, I made goat skulls with big sinuses. Goat skulls with small sinuses. Goat skulls with no sinuses at all. You just can't do this in real life!

I chose goats rather than other horned mammals because they were cheap, easily accessible, and a well-studied lab animal already. An archaeologist colleague got me a fresh goat head, which I then CT scanned. From the CT scan, I developed a 3D model of the skull itself. This skull was then imported into commercial FEA software (Algor FEMpro). Finally, I told the software to "pretend" that the goat's horns were being loaded in various directions, to simulate the forces of head butting. I hit the "analyze" button, and waited the half hour or so for the results. . .

Remember, now, that I made models of goat heads with and without sinuses (see the image below left for external views of two of these models, modified from a figure in the original paper; you can't see the sinus region here). If sinuses truly protect the brain, I would expect 1) that strains in the bone surrounding the brain should be greatly reduced for models with sinuses; and 2) lots of energy should be absorbed in the walls of the sinuses before reaching the brain.

What did I find? Stay tuned for the thrilling sequel to this post!